Free Web-Based HVAC Graphics Editor with Live BACnet Data
Graphivac is a free, web-based HVAC graphics editor for drawing building automation system diagrams. Create professional vector schematics of air handling units, chillers, boilers, and control sequences directly in your browser. No installation needed for viewers.
Link any component to a live BACnet object by dragging and dropping from Wacnet or Vigilia. Your static diagram becomes a real-time dashboard showing actual sensor values, valve positions, and equipment statuses. Switch to historical mode to replay past conditions.
Deploy in one command. Run the Docker image or download the standalone JAR. Host on your network and share diagrams with a URL. Works on Windows, macOS, and Linux.
Best for: system integrators who need live BACnet dashboards, facility managers who want visual overviews of their HVAC systems, and controls contractors who need to document sequences of operation.

Professional HVAC Graphics in Seconds
Perfect, crisp vectorial drawings in seconds.
Drag HVAC components from the symbol library onto the canvas. Rotate, mirror, resize, and connect them with conduits. The result is a clean SVG graphic that looks sharp at any zoom level.
Create custom symbols or import SVGs from the community. Theme support means you can update the look of all your drawings at once without redrawing anything.
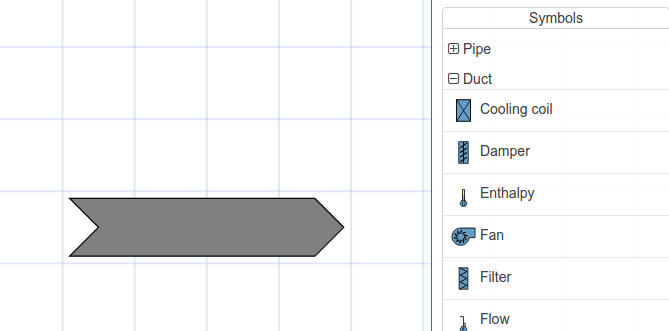
Built-in HVAC Symbol Library
Graphivac ships with a library of standard HVAC components ready to drag onto your canvas:
Need something custom? Upload any SVG as a new symbol, or import symbols shared by the community.
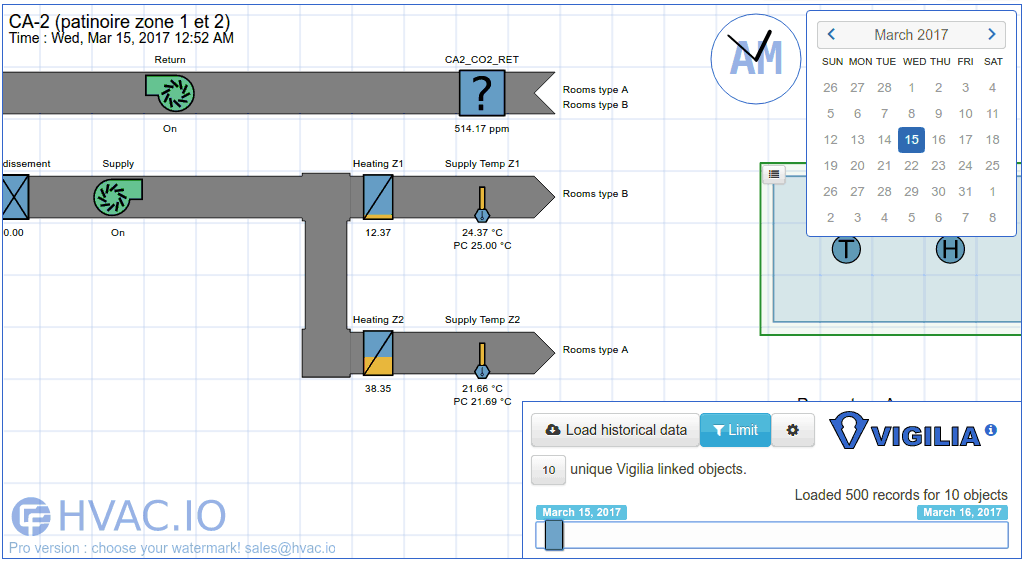
Live and Historical Data Overlay
Graphivac can be synchronized with live or historical data for easy visualization.
Connect to Vigilia to overlay recorded BACnet values on your diagram. Scrub through time to see exactly what happened during a comfort complaint or equipment failure.
Connect to Wacnet for real-time monitoring. Your static schematic becomes a live dashboard showing current sensor readings, valve positions, and equipment statuses.
Drag-and-Drop BACnet Integration
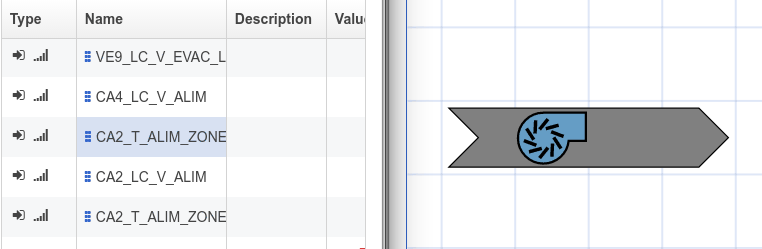
Linking a BACnet object is as simple as dragging and dropping from Wacnet, Vigilia, or any other compatible software.
Each component on your diagram can reference a BACnet device, object type, and instance. Once linked, the component displays live or historical values automatically.
No scripting, no configuration files. Just drag, drop, and your diagram is connected to the real building.
Built for the Web
View and edit drawings directly in your browser.
Share links with coworkers; no installation necessary for viewers.
Import symbols made by other users on the web.
Graphivac uses SVG and standard web technologies. Your diagrams are future-proof and render perfectly on any screen, from phones to 4K monitors.
Extensible with Custom Modes
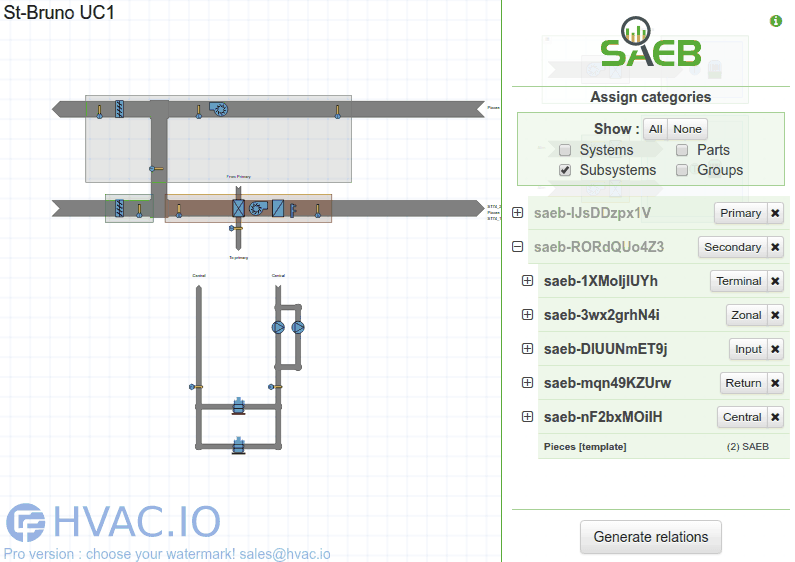
Add new modes to leverage your own tools.
Graphivac's modular architecture allows third-party modes that plug into the editor. Build custom integrations for your specific workflow or equipment.
Why Graphivac?
Most HVAC graphics tools are locked inside proprietary BAS software. You can only create and view diagrams using the same vendor's workstation. Graphivac is independent of any BAS vendor.
Graphivac is a free, vendor-neutral alternative to proprietary BAS front-ends like JCI Metasys Graphics, Honeywell CARE, and Trane Tracer. It can also replace Microsoft Visio for HVAC diagramming, with the added benefit of live BACnet data integration.
| Graphivac | Proprietary BAS Graphics | |
|---|---|---|
| Cost | Free | Included with BAS license ($$$) |
| Vendor Lock-in | Works with any BACnet system | Only works with that vendor's controllers |
| Viewing | Any browser, share a URL | Requires vendor workstation software |
| Live Data | Via Wacnet (any BACnet/IP device) | Only that vendor's devices |
| Historical Data | Via Vigilia (cloud-based) | Requires vendor historian |
| Deployment | Docker, JAR, any OS | Windows workstation only (typically) |
Deploy with Docker
Get Graphivac running on your server in one command:
Then open http://localhost:3000 in your browser. Your data is persisted in the Docker volume. Works on any Docker-capable host: a dedicated server, a Raspberry Pi, or a cloud VM.
Prefer a standalone JAR? Download below and run with java -jar graphivac.jar.
Frequently Asked Questions
Is Graphivac free?
Do I need Wacnet or Vigilia for live data?
Can I create custom HVAC symbols?
How do I share diagrams?
What's the easiest way to deploy?